


 Milk
Milk  Cheese
  Cream
Cream  Juice
Juice  Doogh/Whey
  Powder
  Butter
 What Is the Price of Dairy Products in Different Countries?
In an interconnected world shaped by trade and globalization, understanding dairy product price dynamics is essential. This article compares food prices across different regions, explores dairy prices, analyzes influencing factors, and highlights the economic significance of dairy in various markets.
| Table of Contents |
| 1. The Evolution of Dairy Consumption |
| 2. Global Dairy Market Dynamics |
| 3. Leading Dairy Producers |
| 4. International Trade and Globalization |
| 5. Corporate Influence and Market Structure |
| 6. What is the price of dairy products in different countries? |
| 7. Dairy prices in North America |
| 8. Dairy prices in Germany |
| 9. Dairy prices in Iran |
| 10. Dairy prices (in USD per tonne) |
| 11. GDT Event 360 / 16 July 2024 |
| 12. GDT Price Index over 10 years |
The Evolution of Dairy Consumption
Dairy consumption has a rich history dating back over six thousand years, showcasing its enduring popularity across the globe. Over millennia, there has been a remarkable evolution in the processing, fermenting, and consumption of dairy products. From ancient civilizations to modern times, dairy has remained a staple in diets worldwide.
The dairy industry continues to thrive and evolve, driven by innovation, globalization, and changing consumer preferences. As populations grow and dietary habits shift, the demand for dairy products is expected to rise, further shaping the future of this essential sector in the global economy.
Global Dairy Market Dynamics
As of 2022, the global dairy market was valued at approximately 893 billion U.S. dollars, and projections suggest it will grow to 1,243 billion dollars by 2028. This growth underscores the significant role dairy plays in the global economy and everyday diets.
Milk and dairy products represent approximately 14% of global agricultural trade. Whole milk powder (WMP) and skimmed milk powder (SMP) are the most traded agricultural commodities in terms of production percentage, whereas fresh dairy products, with less than 1% of production traded, are the least traded.
Leading Dairy Producers
Cow’s milk dominates the dairy industry, with India boasting the highest number of milk cows at 59.5 million. However, the European Union leads in global cow milk production, followed by the United States and India. Recent years have also seen notable growth in China's domestic milk production, demonstrating a shift in global dairy dynamics.
International Trade and Globalization
Globalization has facilitated widespread consumption of dairy products, with substantial volumes traded annually between countries. In 2022, dairy exports totaled nearly 68 billion U.S. dollars, marking a significant increase from previous years. The European Union, renowned for its cheese and butter production, commands a substantial 39 percent share of global dairy exports, with countries like France, Ireland, and Germany leading the way.
Corporate Influence and Market Structure
The dairy industry has evolved from small, family-owned farms to large corporations such as Dairy Farmers of America. These entities play a pivotal role in shaping the global dairy market, influencing production, pricing, and distribution worldwide.
Nestlé Group, one of the largest food and beverage companies globally, derived approximately 11 billion Swiss francs from dairy product sales in 2022. Dairy remains a cornerstone of Nestlé's product portfolio, highlighting its enduring significance in the multinational corporation's business strategy.
What is the price of dairy products in different countries?
In our interconnected world, where trade and globalization heavily influence economies, understanding the price dynamics of food and dairy products is crucial. The cost of food products, including dairy and protein, is a pressing issue with far-reaching implications for every continent. In this article, we will examine and compare food prices across various regions, explore market dynamics, and offer insights into specific countries within each area.
Dairy prices in North America:
The North American region encompasses the United States and Canada, both known for their diverse agricultural landscapes. Food prices in this
region are influenced by factors such as weather conditions, agricultural practices, and economic policies. In the United States, dairy consumption is high, making the prices of milk and cheese particularly significant. Meanwhile, in Canada, the pricing dynamics are largely shaped by wheat and oats, which are the primary grains.
In the United States, food prices, including those of dairy, meat, grains, fruits, and vegetables, are generally influenced by production, demand, and trade policies. Dairy products are a cost-effective way to meet recommended nutrient levels. For example, in the US, milk and milk products cost approximately $0.23 per 100 kcal, which is less expensive per kcal compared to meat, poultry, and fish at $0.41 per kcal. They are similarly priced to eggs, sugars, sweets, and other beverages, and only slightly more expensive than grains, dry beans, legumes, and nuts.
Dairy prices in Germany:
As a major European economy, German food prices are influenced by factors such as domestic agricultural policies, international trade and consumer demand. In Germany, 100 kcal of milk and milk products costs around €0.19. Only a few items are less expensive: fats like butter and margarine (€0.08 per 100 kcal), noodles, rice, and bread (€0.11), and sweets and nibbles (€0.13).
Dairy prices in Iran:
Despite being one of the key agricultural producers in the region, it faces many challenges due to economic sanctions that affect trade and currency devaluation. Such factors contribute to food product price fluctuations and affect the cost of meat, dairy and vegetables. Economic sanctions, domestic agricultural policies and global oil prices can affect food prices in Iran.
Here are the prices of regular milk (1 liter) in various countries for 2024:
These prices are approximate and may vary based on location and market conditions.
| Country | Milk (regular),1 liter - USD |
| Hong Kong | 3.28 |
| Taiwan | 2.96 |
| Cuba | 2.88 |
| Singapore | 2.72 |
| Canada | 2.15 |
| Qatar | 2.09 |
| South Korea | 2.08 |
| Norway | 2.03 |
| Germany | 1.14 |
| United States | 1.05 |
| Iran | 0.64 |
Dairy prices (in USD per tonne)
-
Butter: 82% butterfat, f.o.b. Oceania and European Union; average indicative traded prices.
-
Skim Milk Powder: 1.25% butterfat, f.o.b. Oceania and European Union; average indicative traded prices.
-
Whole Milk Powder: 26% butterfat, f.o.b. Oceania and European Union; average indicative traded prices.
-
Cheddar Cheese: 39% maximum moisture, f.o.b. Oceania and European Union; indicative traded prices.
Source: European Commission, USDA
|
Date |
Butter |
Skim Milk Powder |
Whole Milk Powder |
Cheddar Cheese |
| 2012 | 3740 | 3063 | 3336 | 3877 |
| 2013 | 4784 | 4148 | 4730 | 4563 |
| 2014 | 4278 | 3606 | 3854 | 4542 |
| 2015 | 3306 | 2089 | 2537 | 3076 |
| 2016 | 3473 | 1986 | 2481 | 2807 |
| 2017 | 5641 | 2011 | 3163 | 3664 |
| 2018 | 5587 | 1834 | 3060 | 3736 |
| 2019 | 4443 | 2440 | 3186 | 3435 |
| 2020 | 3844 | 2606 | 3041 | 3506 |
| 2021 | 4995 | 3181 | 3855 | 3850 |
| 2022 | 6608 | 3865 | 4253 | 4998 |
| 2023 | 5100 | 2693 | 3327 | 4486 |
| 2024-01 | 5827 | 2714 | 3507 | 3911 |
| 2024-02 | 6078 | 2721 | 3556 | 3961 |
| 2024-03 | 6233 | 2632 | 3435 | 4223 |
| 2024-04 | 6312 | 2568 | 3459 | 4202 |
| 2024-05 | 6595 | 2616 | 3585 | 4230 |
| 2024-06 | 7017 | 2665 | 3621 | 4197 |
The Dairy Price Index worldwide averaged 86.31 index points from 1990 to 2024, peaking at an all-time high of 158.20 index points in June 2022 and reaching a record low of 36.80 index points in August 1990. The latest update on the Dairy Price Index, which includes values, historical data, and charts, was in July 2024. In June 2024, the FAO Dairy Price Index, published by the Food and Agriculture Organization of the United Nations, increased by 1.2% to 127.8 index points - FAO stands for the Food and Agriculture Organization of the United Nations
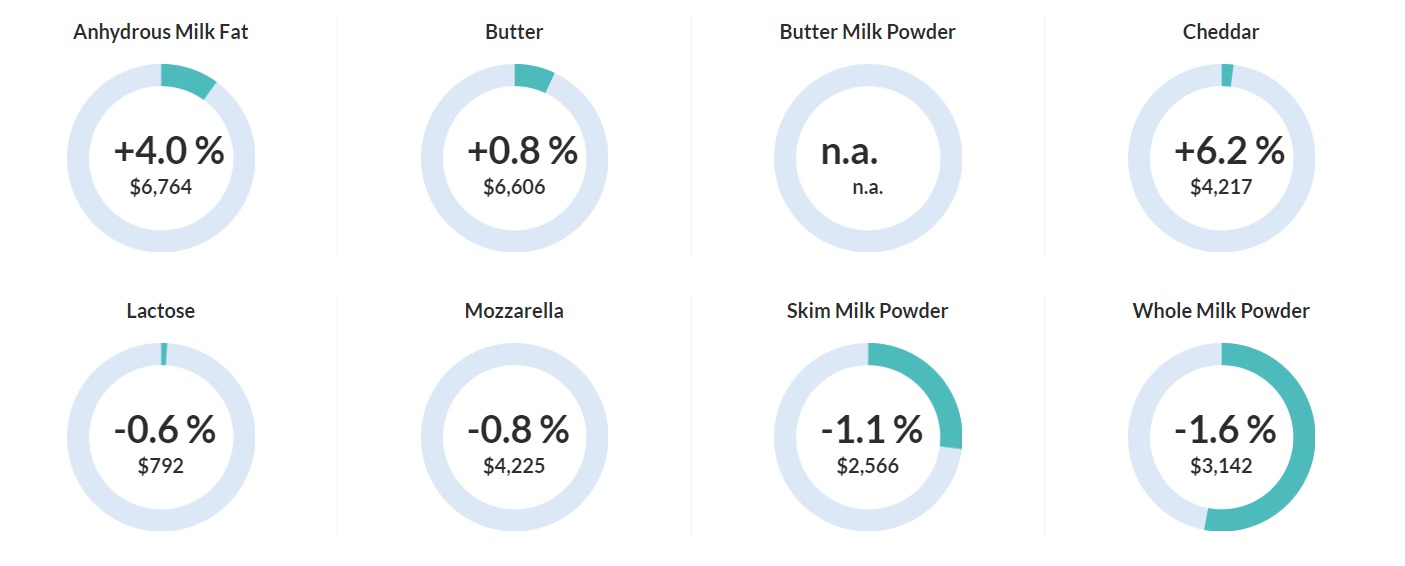
GDT Event 360 / 16 July 2024: Marginal Recovery in Global Dairy Trade Index
Here we analyze the last event of GDT, "The Global Dairy Trade (GDT) Event 360 / 16 July 2024". The Global Dairy Trade (GDT) index showed a marginal recovery in the recent trading auction, with a 0.4% increase following a previous 6.9% decline. The index figure now stands at 1,081, up from 1,077 two weeks ago. Despite some decreases in individual product sub-indices, Anhydrous milk fat (AMF) and Butter saw price increases, while Whole milk powder (WMP) and Skim milk powder (SMP) experienced slight decreases. Overall, the latest auction marked a return to positive growth after consecutive decreases in the past events.
The price of "SMP AVG" has decreased by 0.7%, which translates to a decrease of 20 USD, falling from 2586 USD to 2566 USD.
The price of "WMP AVG" has decreased by 2.3%, which translates to a decrease of 76 USD, falling from 3218 USD to 3142 USD.
The price of "Butter AVG" has increased by 0.9%, which translates to an increase of 60 USD, rising from 6546 USD to 6606 USD.
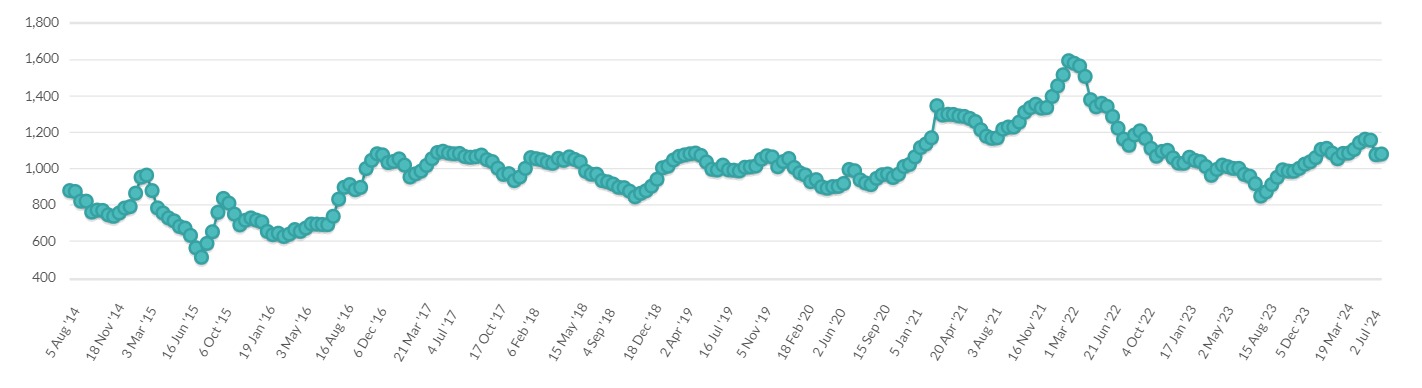
GDT Price Index over 10 years
The GDT Price Index is calculated from the total quantity sold in a Trading Event across all products, contract periods and sellers. You can see the details in the below photo.
Read More: Application of Artificial Intelligence in the Food Industry: 6 Innovative Approaches
Related Blogs

.webp)

 (2).webp)